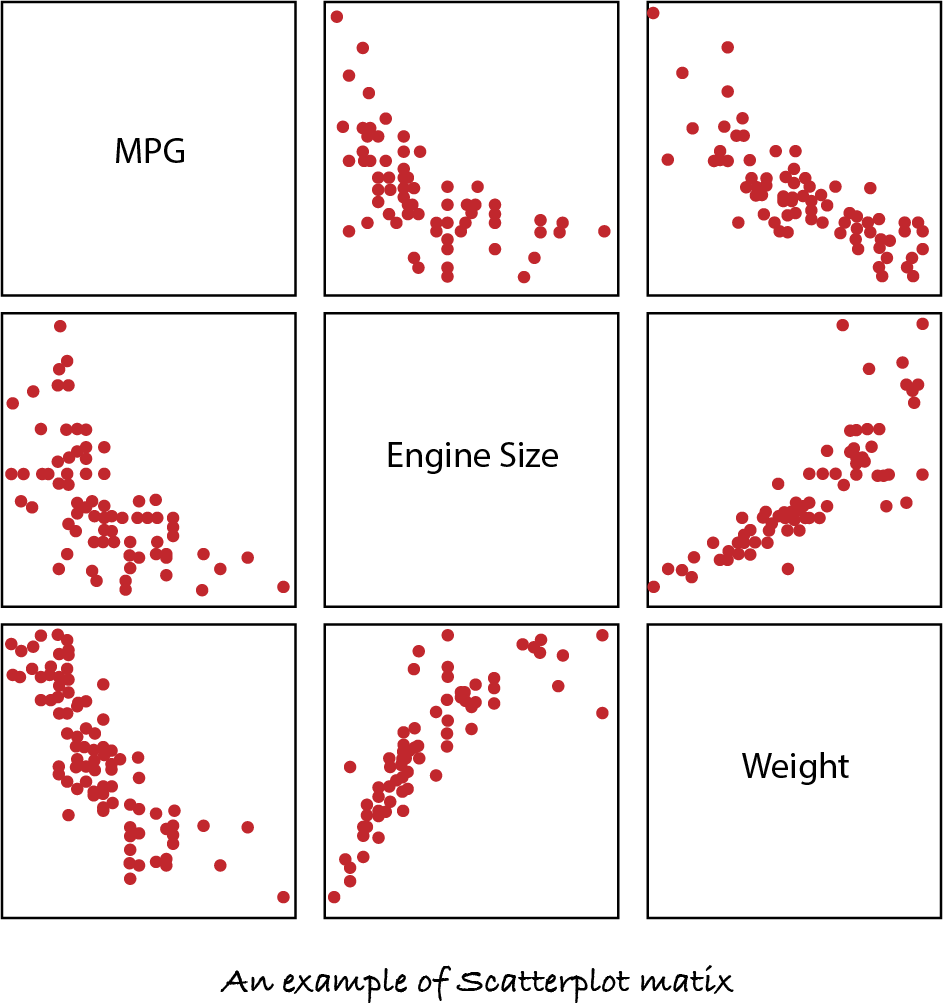
Relatioship between Variables
Scatterplot

- Used to determine relationship between two continuous variables.
- One variable plotted on x-axis, another on y-axis.
- Positive Correlation: Higher x-values correspond to higher y-values.
- Negative Correlation: Higher x-values correspond to lower y-values.
- Examples:
- Body weight and BMI
- Height and Pressure etc.
Scatterplot Matrix

Linear vs Non-Linear Relationship

Variables changing proportionately in response to each other show linear relationship. Linear relationship is an abstract concept it depends what can be called linear and what can’t in a given context. A linear relationship may exist locally with a non linear relationship globally.
Summary Tables
Method for understanding the relationship between two variables when at least one the variables is discrete. Example: Summary information about ages of active psychologists by demographics.
| Ages | (1) Total Active Psychologists | Active Psychologists by Gender | Active Psychologists by Race/Ethnicity | ||||
|---|---|---|---|---|---|---|---|
| (2) Female | (3) Male | (4) Asian | (5) Black/ African American | (6) Hispanic | (7) White | ||
| Mean | 50.5 | 47.9 | 55.1 | 46.5 | 47.9 | 46.4 | 51.1 |
| Median | 51 | 48 | 57 | 43 | 46 | 44 | 53 |
| Std. Dev. | 12.5 | 12.4 | 11.4 | 13.3 | 10.3 | 11.2 | 12.6 |
Discrete Variable(s): Demography: (1), (2), (3), (4), (5), (6), (7) Continuous Variable: Age
Cross-Tabulation Tables/ Crosstabs/ Contingency Tables
- Method for summarizing two categorical variables
- In practice, continuous variables may be at times summarized as categorical variables.
- Example: Age could be divided into categories as young, adult and senior citizen, etc. Income could be divided into categories as poor, middle class, upper middle class, wealthy, etc.
Correlation Coefficient
- A quantification of the linear relationship between two variables
- Ranges from -1 to +1
- Used for variables on an interval or ratio scale

NOTE: Correlation coefficient does not capture nonlinear relationships. Many nonlinear relationships might exist which are not captured (𝑟 = 0) by correlation coefficient.
Enjoy Reading This Article?
Here are some more articles you might like to read next: